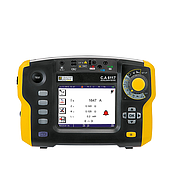
Below is the process analysis basis, derived from the scheme processing attempt by the National Renewable Energy Laboratory (NREL).
Verify measurement data
Before troubleshooting the module, you need to ensure the test is valid:
Open circuit: If no curve is obtained, check the measurement cable connection or series fuse for a broken connection.
Discontinuous connection: If the curve drops sharply or breaks abruptly, the cause is often a misaligned measurement cable or a faulty crimped terminal. The connection should be isolated and repaired before re-measuring.
Identifying 6 types of I-V curve deviations
A normal system has an efficiency coefficient of 90% - 100%. If it is lower, compare it to the following six types of deviations:
If the result is lower, compare it to the following characteristic distortion patterns:
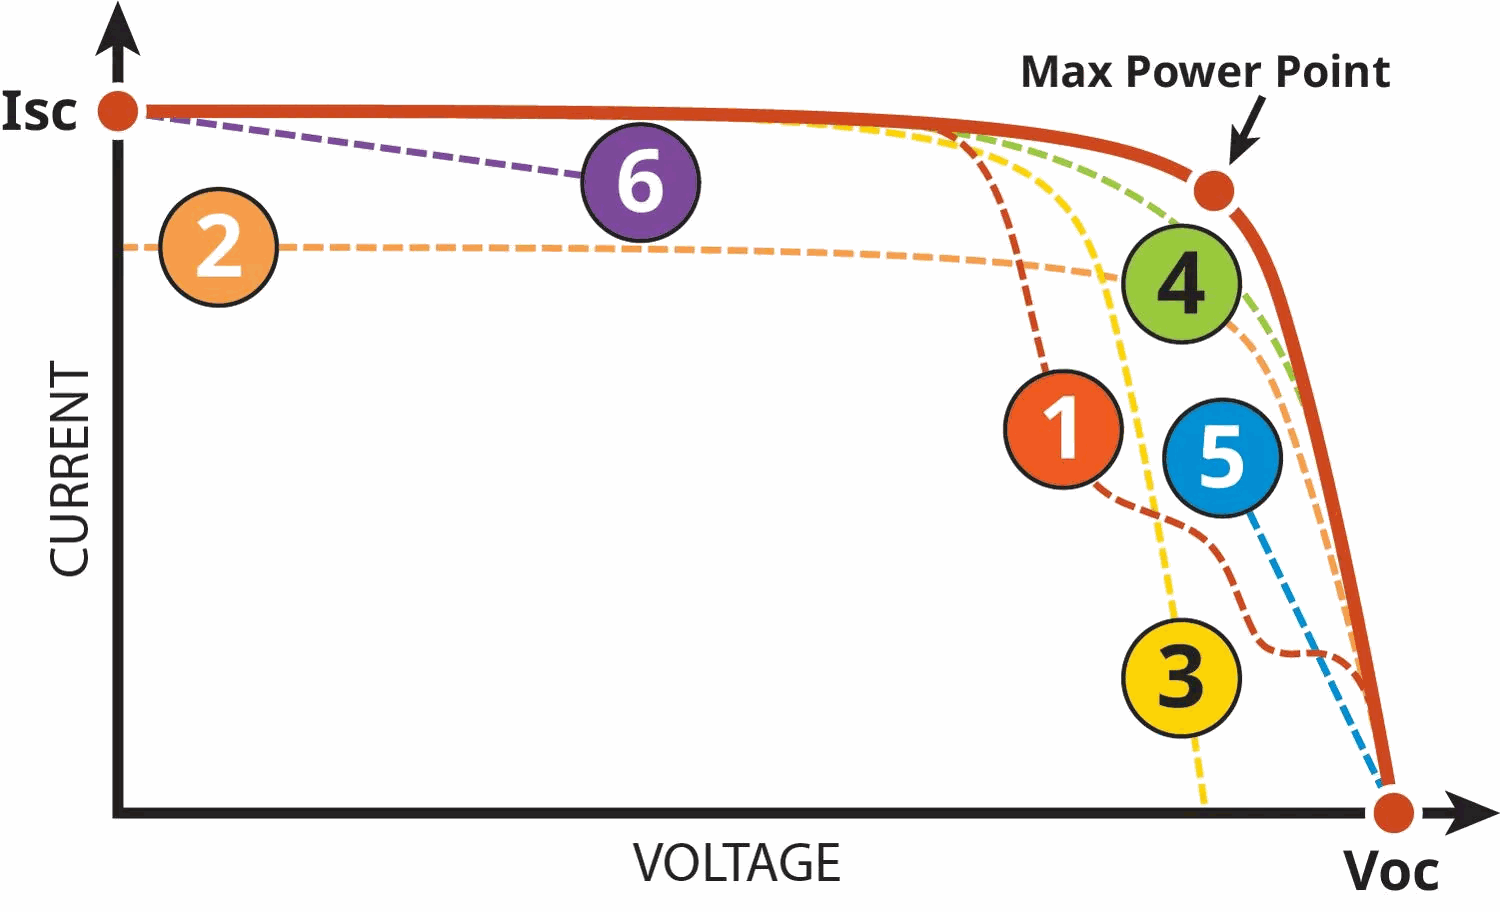
1. Staircase curve
The cracks appear due to uneven current flow between battery cells.
The bypass diode will activate to conduct current through the weak or shaded area of the battery.
Common causes: localized shading, uneven dirt distribution, or faulty battery cells.
2. Low short-circuit current (Isc)
The curve shape remains normal, but the Isc value decreases.
Common causes: inaccurate radiation sensor readings, dirty or heavily covered battery surface.
3. Low open-circuit voltage (Voc)
This is often related to temperature deviations during the measurement process.
Since Vocs are less affected by aging, environmental conditions should be checked before concluding that the module is faulty.
4. The knee joint is rounded
This indicates a decline in performance over time.
The main cause is the aging or degradation of the module.
5. Low voltage ratio (Vmp / Voc)
The vertical section of the curve is steeper than normal.
Comparisons between strings can be used to detect faulty wires or connections.
6. Low current ratio (Imp / Isc)
The horizontal section has an unusually steep slope.
Shadow and dirt effects must be ruled out before inspecting the hardware.
Fluke device applications
Fluke-PVA-1500HE2 this is the optimal device for current 1500V systems. In addition to providing detailed data, it also supports the storage and monitoring of long-term performance trends for the entire project.
Invitation to attend the Fluke Technical Workshop
⇒ Businesses and engineers interested in advanced measurement and maintenance solutions are cordially invited to register for:
Date: Friday, October 30, 2026
Location: Ninh Thuan Province, Vietnam